Errors in Platinum Resistance Thermometers
To fully understand the accuracy of a temperature measurement, it is imperative that all the sources of errors are understood and where possible quantified.
Accuracy is not a statement of the correctness of a temperature sensor independent of its system. It is the total accuracy of the sensor system, and process for which one needs to measure temperature.
This accuracy value is a summation of the sensors’ interchangeability value, as well as all the errors sources associated with the system, the measurement location, and the installation of the RTD. The method that is used for calculating the accuracy of the system is by calculating the root-sum-square (RSS) of all the sources of error and variation of the probe, and the errors related to the system.
Generally, the sensors’ interchangeability value is the largest component of the accuracy analysis and can be reduced to near zero by matching the sensor with a transmitter.
As the temperature range of use expands, the errors associated with stability, repeatability, and stem conduction will begin to play a larger role in the system accuracy at higher temperatures. With all measurement devices, there are common sources of error that have to be accounted for.
In PRTs, these sources of error are (1) interchangeability, (2) insulation resistance, (3) stability, (4) repeatability, (5) stem conduction, (6) hysteresis, (7) calibration and interpolation, (8) lead wire resistance, (9) self-heating, (10) rime response, and (11) thermal EMF.
Errors in Platinum Resistance Thermometers Due to Interchangeability
Interchangeability refers to the “closeness of agreement” in the R versus T relationship of a PRT to a predefined nominal R versus T relationship. Since it is not possible to manufacture a PRT that exactly replicates a predefined nominal R versus T relationship, a tolerance band about the relationship must be established, and this is what is called the “interchangeability” of the PRT.
The two most widely used industrial PRT standards in the United States are ASTM E1137 and IEC 60751. Fortunately, both of these standards have the same nominal R versus T relationship, but they do not have the same interchangeability tolerance.
These standards use the term “tolerance” to describe the permissible variation in the R versus T relationship, define tolerance as a function of temperature in °C, and offer multiple tolerance levels—referring to them by either a tolerance “class” or tolerance “grade.”
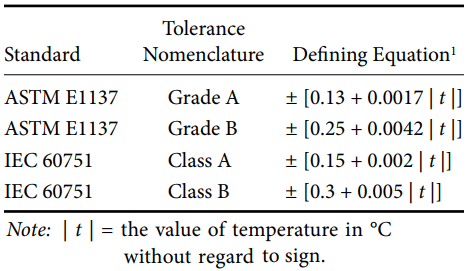
Table 1 shows the interchangeability tolerances for these two industry standards while Figure 1 shows a comparison of the interchangeability levels graphically.
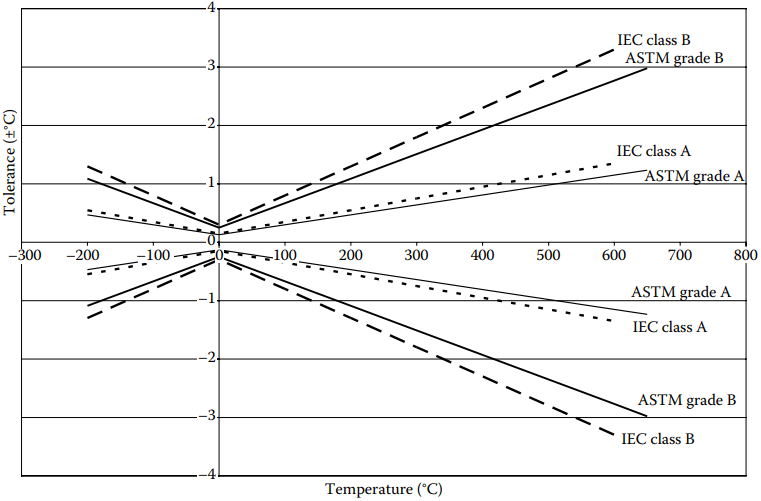
It is worth noting that many times manufacturers will define interchangeability in terms of a percent, such as 0.06%. In these cases, the percent refers to a percent of resistance valid only at 0 °C. For example, 0.06% interchangeability is ±.06 Ω (±.15 °C) for a 100 Ω PRT.
This is not enough information to know what the tolerance is at other temperatures. The user should be provided with either a statement that the tolerance meets one of the industry standard classes or grades, or a table showing the tolerances, or an equation similar to the ones shown in Table 1 that define the tolerance over the entire rated temperature range of the PRT.
Errors in Platinum Resistance Thermometers Due to Insulation Resistance
Insulation resistance (IR) refers to the electrical resistance between the sensing circuit and the metallic sheath of a PRT. It is important for the sensing element circuit to be insulated from the sheath because electrical leakage can cause an error when measuring the resistance of the sensing element.
Any error in measuring the resistance will translate to an error in the indicated temperature. Resistance is a parameter that cannot be measured directly. The typical method used to measure the resistance of an industrial PRT is to apply a constant current and measure the voltage drop to determine the resistance.
If a portion of the applied current has the opportunity to “leak out” of the circuit, through a low IR, then a false resistance reading will be obtained for the sensing element.
ASTM E1137 and IEC 60751 specify a minimum IR value at ambient temperature (25 °C) as well as at elevated temperatures.
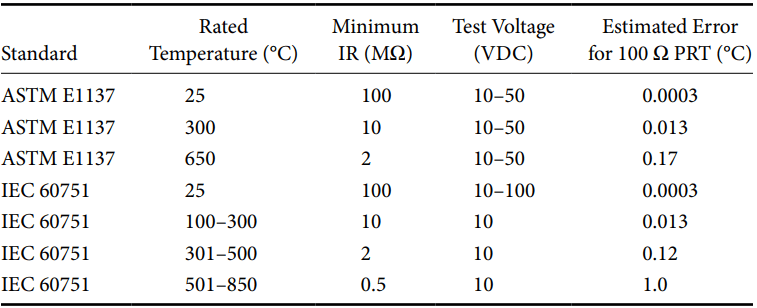
Table 2 shows the minimum IR values required by these standards and the estimated temperature error values calculated for a 100 Ω PRT. It is easy to see by examining this table that the minimum IR requirement decreases as the temperature increases.
This represents the typical behavior of an industrial PRT and is a reason why the ambient temperature IR requirements are generally much higher than necessary for accurate operation at ambient temperature.
Errors in Platinum Resistance Thermometers Due to Stability
Stability refers to the ability of a PRT to maintain its R versus T relationship overtime as a result of thermal exposure. Both ASTM E1137 and IEC 60751 address resistance change due to thermal exposure; however, the criteria are somewhat different.
ASTM E1137 essentially states that the PRT must meet the resistance tolerance for a Grade A or Grade B sensor as applicable, after 4 weeks (672 h) of exposure to the maximum rated temperature.
IEC 60751 states that the PRT can change at 0 °C by the equivalent of 0.15 °C for a Class A sensor and 0.30 °C for a Class B sensor after 250 h at maximum rated temperature.
Many manufacturers state stability specifications more like the IEC 60751 standard, stating a maximum change at 0 °C as a result of exposure to maximum rated temperature for a given period of time.
These specifications typically do not require the PRT to remain within the original R versus T tolerance after the exposure. Typically three or four temperatures including the maximum rated temperature would be adequate to estimate stability.
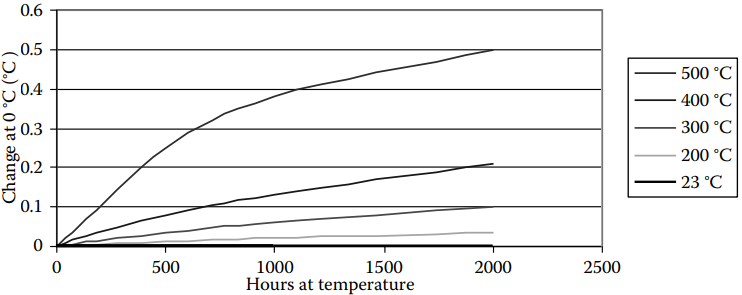
The graph in Figure 2 gives a realistic representation of the stability of a typical industrial PRT at five different exposure temperatures. By examining Figure 2, a few generalizations can be made about the stability of this industrial PRT.
These generalizations hold true for the behavior of most industrial PRTs; however, the shape of the curve will be unique based on the specific PRT design. If a better understanding is needed regarding a specific PRT, the manufacturer of that PRT should be consulted.
(i) The resistance change due to exposure to room temperature and below can be considered negligible. Test results on several industrial PRTs have shown that the ice point resistance shift following 25,000+ h at 23 °C is less than 0.01 °C. This is a very small change in comparison to other potential error sources.
(ii) The magnitude of the change increases with increasing exposure temperature and is a maximum at maximum rated temperature. For example, the change after 1,000 h will be larger for an exposure temperature of 500 °C than an exposure temperature of 400 °C.
(iii) The magnitude of the change is not linear with temperature and cannot be extrapolated beyond the upper temperature limit. For example, the change caused by exposure to 550 °C cannot be reliably predicted based on the changes observed due to 500 °C or 400 °C exposure.
(iv) The rate of change over time is fairly linear and remains fairly constant. For example, the change after 2,000 h can be conservatively approximated as twice the amount of change as was present after 1,000 h for the same exposure temperature.
Given the earlier generalizations along with the information illustrated in Figure 2, a reasonably accurate estimation of stability can be made for the hypothetical example of a PRT at 350 °C for 1 year.
The stability can be estimated by looking at the graph and estimating a change after 1,000 h for a 350 °C exposure. According to the graph, this would be approximately 0.1 °C. Multiplying this number by 9 to determine the cumulative effect over 9,000 h gives a result of 0.9 °C maximum change at 0 °C after 1 year of exposure to 350 °C.
This is likely to be a more accurate estimate than extrapolating the IEC 60751 requirement of 0.15 °C for Class A (or 0.30 °C for Class B) per 250 h out to 9,000 h, which would result in an estimated value of 5.4 °C for Class A (or 10.8 °C for Class Errors in Platinum Resistance Thermometers Due to Repeatability
Repeatability refers to the ability of a PRT to maintain its R versus T relationship when measured under the same test condition after experiencing thermal cycling throughout a specified temperature range. Industrial specification IEC 60751 refers to this as “Effect of temperature cycling” and states that the PRT can change at 0 °C by the equivalent of the class tolerance after 10 thermal cycles between the PRT’s upper and lower temperature limits.
The standard also contains a note to the effect that improved performance may be achieved for certain thermometers when used over narrower temperature ranges, but no specific requirements are given.
ASTM E1137 does not contain any requirement for thermal cycling performance other than to state that the PRT must be capable of continuous operation over the specified temperature range. Neither of these industry standards provides substantial information about the performance of a PRT as a result of thermal cycling.
A practical and useful approach to understanding PRT repeatability would be a set of specifications that state the change due to a varying number of cycles over varying temperature ranges. Typically three or four temperature ranges including the maximum rated range and cycles up to 1,000 would be sufficient.
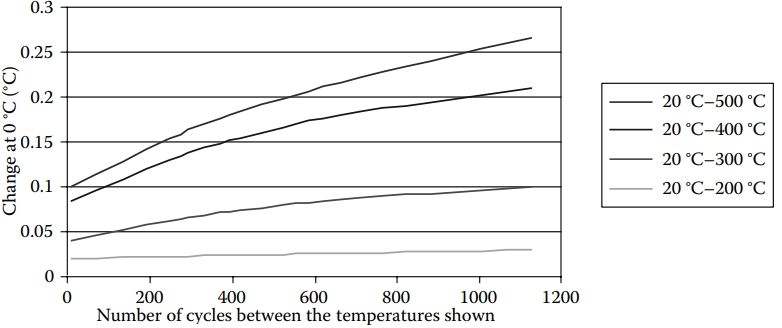
The graph in Figure 3 gives a realistic representation of the repeatability of a typical industrial PRT that has a temperature rating of 0 °C–500 °C, over four different thermal cycle temperature ranges. From Figure 3, several generalizations can be identified regarding repeatability.
The generalizations hold true for the behavior of most industrial PRTs; however, the actual values, maximum temperature ranges, and so on will all be unique based on the specific PRT design. If a better understanding is needed regarding a specific PRT, the manufacturer of that PRT should be consulted.
(i) A disproportionate amount of change can occur during the first few thermal cycles. Figure 3 starts at 10 thermal cycles, which align with a typical specification such as “0.1 °C maximum change after 10 cycles from 20 °C to 500 °C.” 2. There will be some temperature range for which there is virtually no difference in repeatability between 10 cycles and 1,000 cycles. In the case of this example, that temperature range is 20 °C–200 °C.
(iii) The maximum non-repeatability will occur due to cycling over the maximum rated temperature range of the PRT. Smaller ranges will result in smaller changes.
(iv) The change at intermediate temperature ranges and numbers of cycles can be estimated by interpolating between known values. For example, the repeatability after 500 cycles from 20 °C to 350 °C could be estimated as approximately 0.13 °C.
(v) The change can be estimated as linear with the number of cycles for any given temperature range. For example, the change after 2,000 cycles can be conservatively estimated as two times the change after 1,000 cycles. This method should result in a conservative estimate for most high quality PRTs.
Given the information contained in Figure 3, a reasonable and useful estimate could be made for the repeatability of the PRT under various conditions.
An application example would be the use of a PRT in a process that must heat from room ambient to 350 °C for 1 h and then cool back to room ambient temperature.
Assuming this process runs three times per day for an entire year, the error due to repeatability could be estimated from Figure 3 as the value shown at 1,095 cycles (3/day × 365 days/year) in the region between the 300 °C line and the 400 °C line. From Figure 3, an estimate of 0.16 °C could be made.
Keep in mind that this error is separate from the error that would be created due to the 1,095 h of heat soak at 350 °C: that error is considered in the stability component of the overall error.
Errors in Platinum Resistance Thermometers Due to Hysteresis
In PRTs, thermal hysteresis results in a difference in resistance at a given temperature based on the thermal history to which the PRT was exposed.
More specifically, the resistance of the PRT will be different when the temperature is approached from an increasing direction versus a decreasing direction, and the magnitude of the difference will depend on the magnitude of the temperature excursion and the design of the PRT.
Industrial specification IEC 60751 refers to this as “Effect of hysteresis” and states that the PRT resistance shall be measured at the middle temperature after exposure to the lower limit temperature and after exposure to the upper limit temperature.
The acceptance criterion that is given is that the resistance at the midpoint cannot change by more than the tolerance value at the test temperature for the respective tolerance class tested. It does not state that both measurements must meet the resistance tolerance; therefore, it is possible that the hysteresis effect could result in the sensor producing an out-of-tolerance measurement.
ASTM standard E1137 does not contain any requirement for thermal hysteresis, however; a test method for hysteresis is contained in ASTM standard E644, which would allow testing over ranges less than the maximum rated range of the PRT.
While the requirement of the IEC 60751 standard is fairly well defined, it does not provide any information about hysteresis when the range is less than the maximum, and neither of these industrial PRT standards provides information about the hysteresis performance at temperatures other than the midpoint temperature where hysteresis is considered to be at its maximum.
A practical and useful approach to understanding a PRT’s hysteresis would be if the hysteresis was specified as a percent of span to which the PRT was exposed.
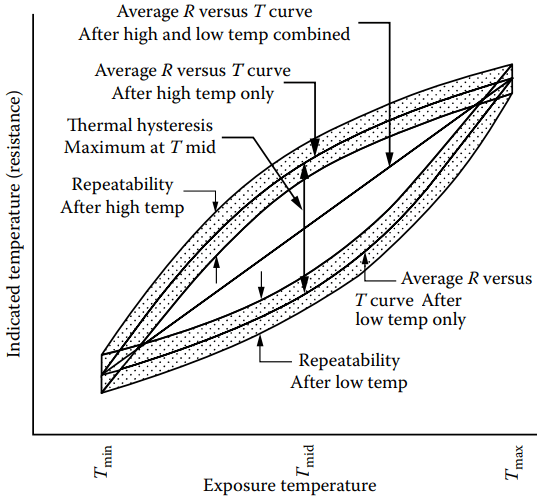
Figure 4 shows a hypothetical representation of what could be considered a very well behaved hysteresis loop for a typical industrial PRT. The hysteresis is a maximum at the midpoint temperature and a minimum at each end point.
While there is still some variability expected in the measurements taken at the end points, this variability is caused by the PRT repeatability, not by hysteresis.
One simplified method to estimate the hysteresis error at any temperature within the range of use is to perform a linear interpolation between the midpoint temperature and the temperature of interest. Since no known equation exists for this estimate, one is offered here for the purpose of this article and it is given as
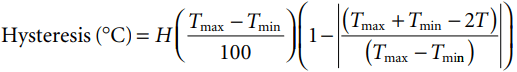
Where,
H is the hysteresis error coefficient in % of temperature span.
Tmax is the maximum temperature of span.
Tmin is the minimum temperature of span.
T is the temperature where hysteresis is being determined. (All temperatures are in °C.)
To provide a context for the order of magnitude of the hysteresis error, several examples were created.
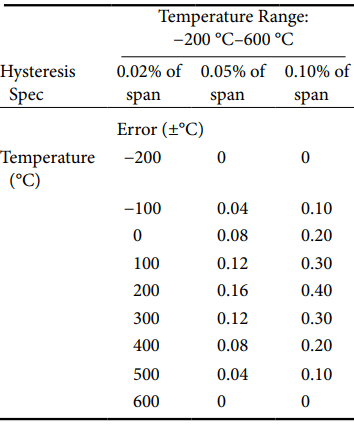
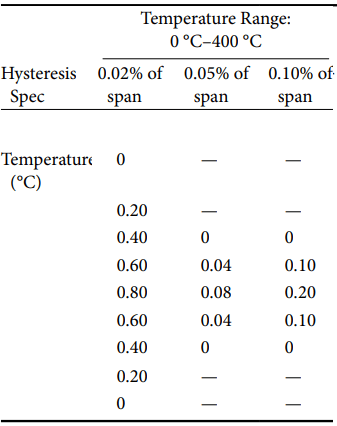
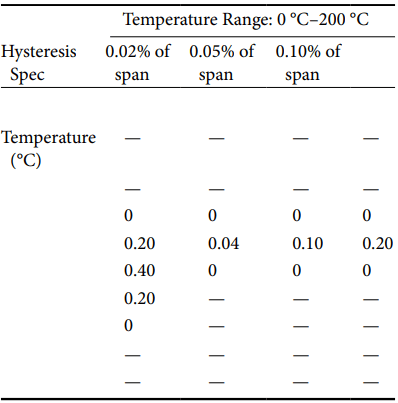
Table 3 shows the estimated hysteresis error in °C calculated using this method for PRTs with varying specifications over several common temperature ranges.
By examining the values in Table 3, it is easy to see that the hysteresis error can be nearly negligible or approaching as much as ±1 °C.
Errors in Platinum Resistance Thermometers Due to Stem Conduction
Stem conduction is the error that results from the PRT sheath conducting heat into or out of the process of interest. ASTM offers a test method to compare PRT performance in the lab, specifying a maximum error of 0.13 Ω (0.25 °C) when the PRT is immersed 2 in. into an ice bath. International Electro-technical Commission (IEC) defines the “minimum immersion depth” to be that where a 1 °C error is produced in an 85 °C water bath.
The test methods are an effective method to compare sensors, although the thermal dynamics of the installed sensor can produce different stem conduction results than those found from the lab test method.
The specific installation, heat transfer conditions, and the temperature difference— process to ambient—can have a significant influence on the stem condition error. To manage this error,
- Strive to achieve the ideal immersion depth of 10× the sensor diameter plus the element sensitive length. For a 0.25 ft diameter sheath with a 1 ft element length, the ideal immersion depth is 3.4 ft.
- Select a sensor design that is tip sensitive. These are typically smaller diameter, specifically in the element area.
- Insulate the portion of the sensor external to the process.
Errors in PRT Due to Calibration/Interpolation
These are errors that occur due to calibration uncertainty at the cal points or between cal points due to propagation of uncertainty, or curve fit errors.
The ASTM and IEC standards do not address this error source beyond the requirement of the resistance tolerance limits. For most industrial sensor uses, these errors are less significant.
To minimize these errors, select a calibration laboratory with low calibration uncertainties and a PRT with low repeatability and hysteresis error values.
Errors in PRT Due to Lead Wire
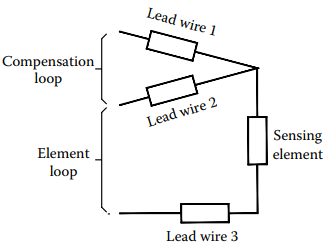
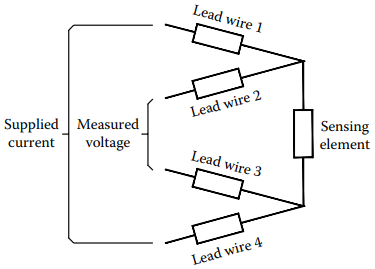
To provide a practical temperature measuring instrument, it is necessary to attach extension leads to the platinum sensing element. If not properly selected for the application, the number and type of extension leads used can introduce significant errors into the temperature measurement. See Figure 5 for the different connection methods.
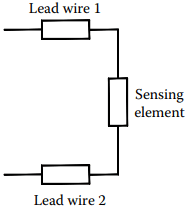
The two-lead-wire circuit has no mechanism to compensate or eliminate the resistance of the lead wires from the resistance of the element. As the temperature increases, the resistance of the lead wires will also increase. Unlike the platinum element, the resistance in the lead wires increases in a nonlinear manner, which will result in inaccurate measurements.
The two-lead-wire designs are only useful where extension lead resistance is insignificant to the sensing element, either short leads or large sensing resistance, and an accurate temperature measurement is not required.
The three-wire configuration provides a compensation loop that can be used to subtract the lead wire resistance from the measurement to provide a value for just the element resistance. The resistances of two different electrical paths are used. The first is through the element like a two-wire measurement. The second is to one end of the element and back without going through the element to approximate the lead resistance. The measurement is obtained by subtracting the second electrical path from the first.
Complete compensation in this method is predicated on the resistance of each of the leads being exactly equal. Unfortunately, this is seldom the case, and steps in the design and application of a three-wire sensor must be taken to maintain the accuracy of the measurement.
The method that offers the highest accuracy temperature measurement is the four-wire scheme. Having two wires either side of the element allows for a measurement current to be passed across the element via two of the leads and a voltage measurement to be taken through the other two leads. The resistance is simply then calculated using Ohm’s law.
The impedance of the meter taking the voltage measurement is sufficiently high to prevent any current from flowing through the leads being used for the voltage measurement. The current flowing through the other two leads and the element is the same throughout the circuit. Therefore, by measuring the voltage across the element and dividing it by the known current yields just the resistance of the element.
In applications where the sensor must be at a long distance from the measurement equipment, temperature transmitters are often used. Temperature transmitters are capable of measuring the resistance of the RTD probe and converting the measurement to a signal that can be transmitted longer distances, typically a 4–20 mA signal.
It is not uncommon for measurement equipment, even respected brands, to take short cuts when it comes to lead wire connections. Be especially wary if the manual instructs the user to use jumpers to unused terminals. This will almost always cause the resistance of at least one lead to be included in the measurement.
Measurement equipment that requires internal settings to be changed specifically for two-, three-, or four-wire measurement is fewer suspects. It is good practice to verify how the measurement is being taken by switching between settings and/or disconnecting a lead to verify that the output is congruent with the connections.
Errors in PRT Due to Self-Heating
Self-heating errors are caused by the inability of the element to dissipate the heat generated by the required power applied via the measuring current.
The ASTM Standard requires the error to be a maximum of 1 °C when 33 mW is applied in 25 °C water. IEC requires a maximum error of 0.05 °C in 25 °C water when the maximum operating current is applied. These test methods are good laboratory comparison methods.
For PRTs installed with proper immersion in a process, the operating current is 1 mA or less, so the power (I2R) for a 100 Ω PRT is also small (0.02 – 0.39 mW). Lager errors can occur in sensors with resistances in the 500 – 1,000 Ω range, or when the process exhibits poor heat transfer conditions such as still air or low-pressure gases.
Errors in PRT Due to Time Response
A time response-related error can be produced during temperature transients if the PRT cannot respond to the change in temperature fast enough. During steady-state or near-steady-state operation, this error is zero.
ASTM and IEC do not define this error, although there is a test method to characterize a PRTs’ response time for comparison purposes.
When it is important to monitor transient conditions, this error can be minimized by selecting a sensor with a faster lab-tested response time and assessing the related rate of change to the process to best match the sensors’ time response performance.
Errors in PRT Due to Thermal EMF
Thermal EMF errors are also known as the thermocouple effect. This error is caused by various wire compositions, wire connections in homogeneity of materials, and temperature gradients within the PRT.
The ASTM and IEC Standards offer guidelines at high sensing currents—although when an EMF influence exists, it will have a greater effect at lower currents near the standard operating current. This error occurs primarily in direct current systems.
To minimize thermal EMF errors, select a PRT with a low specified EMF. Also, using alternating current circuitry and appropriately selected transmitters can eliminate EMF influences.
Errors in PRT Due to Calibration and Maintenance
Testing programs such as periodic calibration or performance testing are essential to verify the accuracy and general health of PRTs. Some industrial PRTs are factory-calibrated to a temperature such as at the ice point, but PRT users might want to calibrate them at other temperatures, depending on their application. The periodic calibration results can be compared to prior or original calibration values to help determine if it is necessary to repair or replace the instrument, or if calibration is required more often.
An RTD’s stability depends on its working environment. High temperatures can cause drift and contamination of the platinum wire. Shock, vibration, and rough handling will put stress in the platinum wire and change its characteristics, and eventually cause damage that may not be recoverable.
Humidity can get into the sensor and reduce the IR. Under extreme operating conditions, a sensor should be calibrated more frequently. If several calibrations are completed without a significant change, then the time between calibrations can be extended based on the user’s quality system guidelines; at least once a year is common.