Standard Test Conditions for PV Modules
PV modules have to undergo some very stringent tests and certifications before they ever reach the consumer (or the installer, for that matter). An Underwriters Laboratory (UL) test protocol, UL1703, covers PV modules and requires testing of both the electrical and mechanical portions of each and every PV module.
Any module you want to consider purchasing or installing should have UL1703 certification.
As part of the UL certification process, the PV manufacturer has to provide prescribed information on the module itself by applying a label on the back. Plan to use the information on the electrical characteristics most often.
Other high-value information, such as mechanical data, isn’t always found on the listing label, but you can usually track it down on the module’s spec sheet.
After you’re familiar with the different electrical specifications you can appreciate the consistent baselines that allow you to
more easily compare the performance characteristics of different modules. I cover these baselines, as well as the effects of various environmental conditions on them, in the sections that follow.
Standard Test Conditions PV Modules
All PV module manufacturers test their modules under standard test conditions (STC). The three main elements to the STC are: cell temperature, irradiance, and air mass — all of which are variable conditions that the PV modules will
be exposed to after they’re installed. Because these conditions affect the modules’ power output, PV manufacturers had to establish a value for each of these elements that everyone could test to and report their results. Those standard values are as follows:
Cell temperature: The STC for cell temperature is 25 degrees Celsius or 77 degrees Fahrenheit. (Note that it’s cell temperature, not air temperature.)
When a PV module is operating in the sun, it typically gets much hotter than 25 degrees Celsius. Depending on the location and the way the module is mounted, cell temperatures of 75 degrees Celsius aren’t uncommon when the modules are in full sun.
Irradiance: Irradiance, simply stated, is the intensity of the solar radiation striking the earth. The STC value for irradiance is 1,000 watts per square meter (W/m²). Irradiance values vary from 0 W/m² to 1,250 W/m². The 1,000 W/m² value represents full sun, or peak sun, which is common to many terrestrial locations.
Air mass: Air mass is a representation of how much atmosphere sunlight must pass through to strike the earth. The STC value for air mass is 1.5 (AM 1.5). Actual air mass values vary widely depending on one’s location on the globe, the time of year, and the time of day.
Of these three elements, you should concern yourself with compensating for differences in cell temperature and irradiance values because these two variables directly and measurably affect a PV module’s voltage and current in the following
ways:
Voltage: The higher the cell temperature, the lower the module voltage — and vice versa.
Current: The higher the irradiance value, the more current is pushed through the module.
You maximize a PV module’s electrical output by keeping the module as cool as possible and pointing it directly at the sun as much as possible.
Environmental Effects on Standard Test Conditions
When you’re in the field and need to verify a module’s power output, you must be able to apply voltage temperature coefficients and calculate the module’s current output based on the irradiance received at that time; the following sections introduce the info you need to know.
Temperature: You need to be able to calculate the change in voltage due to cell temperature because every electrical component connected to a PV array has input voltage requirements that must be met.
Regardless of the type of PV system used, if you apply a voltage in excess of what the equipment is rated for, you may damage it beyond repair; if you don’t send enough voltage, the electronics will shut down.
The excessive voltage is considered a safety concern, whereas the lack of voltage is considered a performance concern.
The 2008 version of the NEC states that if the manufacturer supplies the voltage coefficient data, you must use that information to calculate the temperature-adjusted voltage.
If the manufacturer doesn’t supply this information, you can use a table, which is included in Article 690.7 of the NEC®, to calculate it. The NEC® offers no provision for a loss of voltage due to high temperatures, but this consideration is still important to keep in mind.
One of the worst calls you can get from a client is the one where she tells you her system shut down on the sunniest day of the year because the voltage loss was too excessive.
There are two distinct voltage coefficient values, one for Voc and one for Vmp. The coefficient value for Voc is always less than the coefficient for Vmp.
After all, there’s a greater change in the voltage when the module is operating (Vmp) than when it isn’t doing any useful work (Voc).
When working with a crystalline PV module, check the module’s spec sheet for the Voc and Vmp values. If they’re not there, the manufacturer should be able to supply them because they’re known quantities; you just have to ask either the person
you’re buying the modules from or the manufacturer for this information.
If the information isn’t readily available, you can use the following values and be within reason (unless of course you’re working with thin film PV; in that case, you have to obtain the data from the manufacturer and can’t use these values):
Temperature coefficient for Voc = –0.35%/°C
Temperature coefficient for Vmp = –0.5%/°C
Notice the negative number in front of the coefficient; it represents the inverse relationship. So as the temperature increases (a positive change in temperature), the voltage decreases. As the temperature goes down (a negative change in temperature), the voltage increases.
Your reference temperature is always going to be the STC temperature of 25 degrees Celsius. So when you calculate the change in voltage, you have to compare the cell temperature in that scenario to 25 degrees Celsius.
For example, if you want to find out what percentage change the module’s Voc will have when the cell temperature is 15 degrees Celsius, you need to subtract the STC temperature from the cell temperature:
Cell temperature – STC temperature = Difference in temperature 15°C – 25°C = –10°C
You now know that the cell temperature is 10 degrees Celsius less than the STC temperature, which means you can use this information in conjunction with the given temperature coefficient to determine the percentage change.
Difference in temperature × Voltage temperature coefficient = Percentage change in voltage
–10°C × –0.35%/°C = +3.5% change in rated Voc
Irradiance: The change in irradiance directly affects a module’s current output. You may need to verify the performance of a single module or an entire array.
By measuring the irradiance value and the current output of the module (or array), you can compare the two to see whether the modules are operating as expected.
Without knowing the exact irradiance measurement, you can’t accurately determine whether the current values are reasonable.
To calculate this change (which is an important task when commissioning, or turning on, an array), you first need to know what the irradiance value is.
You can figure this out by using an irradiance sensor that points in the same direction as the module (or array). If you’re using a hand-held sensor, place the bottom of the sensor on the frame of the module and read the digital display to see the irradiance value at that moment.
Because the module’s output is directly proportional to the irradiance and the STC value for irradiance is 1,000 W/m², you can estimate the percentage change of current by measuring the irradiance and dividing that by 1,000 W/m².
For example, if the measured irradiance is 650 W/m² and you want to know what the effect is on the current value, then you’d perform the following calculation:
650 W/m² ÷ 1,000 W/m² = 0.65
The current is therefore 65 percent of the module’s STC value.
The irradiance sensor reports the values in terms of W/m², and because the STC is 1,000 W/m², this makes the conversion easy on you. When you’re in the field, you can expect to see irradiance values at or below 200 W/m² and up to 1,250 W/m².
Regardless of the value you see, you can simply multiply the current value at STC by the percentage you calculate to determine the estimated current value under those irradiance conditions.
Relating Current and Voltage in IV Curves
As a PV system designer and installer, a graph that you’ll soon come to know and love is the current-versus voltage curve, also known as the IV curve. (I stands for current, and V stands for voltage.) The IV curve graphically represents the relationship of a module’s current and voltage.
See Figure 1 for a sample of a typical IV curve at STC, which is the most common way manufacturers represent the curve (I cover STC in the earlier “Standard test conditions” section). Following are the five major electrical characteristics graphed in Figure 1:
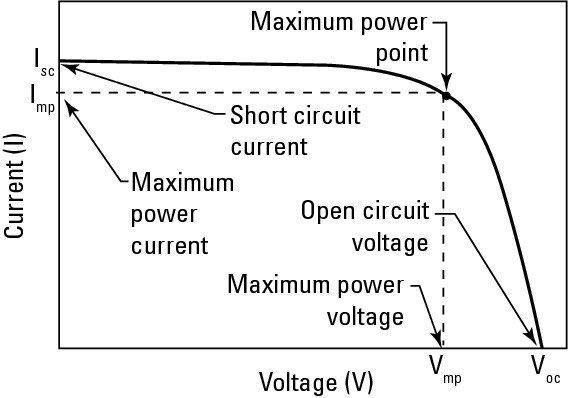
MPP: Where current multiplied by voltage results in the highest power output
Voc: Where the voltage is at its maximum for a particular temperature and current equals zero
Vmp: Where the voltage value intersects the MPP
Isc: The point on the curve that represents a voltage value of zero and the amount of current that would flow if the positive and negative wires were placed in direct contact with each other
Imp: The point where the current value intersects the MPP
You can also use an IV curve to show how environmental conditions such as the temperature of the solar cells and the intensity of the sunlight affect a PV module’s current and voltage output.
An IV curve with varying temperature As I mention in the earlier “Temperature” section, a module’s voltage decreases as the cell temperature increases. This is a very linear and measurable effect.
In Figure 2, I show how a typical PV module’s IV curve varies with changing temperatures.
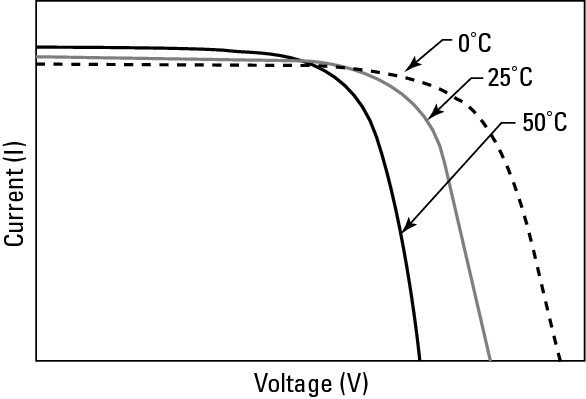
Notice how the curve moves left and right along the horizontal voltage axis but moves relatively little along the vertical current axis. This movement in the curve results in the MPP moving along with the voltage, allowing you to see that the temperature changes directly affect the voltage output, which in turn directly affects the power output.
The amount of current actually increases as the temperature increases, but
the amount of that change is so much less than the change in voltage that
you don’t really need to consider it during the design process.
An IV Curve with Varying Irradiance
Irradiance varies greatly each day, starting at 0 W/m² just before daybreak and climbing higher than 1,000 W/m² at any given time. The amount of irradiance striking a PV module directly affects how much current the module can put out.
Just like the relationship of voltage and temperature, this is a linear relationship that you can calculate over various conditions.
at varying levels of irradiance.
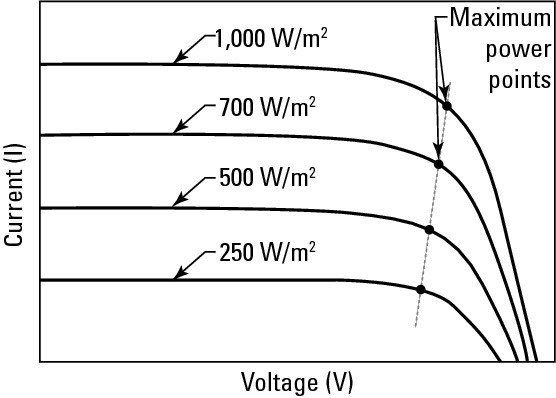
Figure 3 shows how the IV curve varies with changes in irradiance. Notice how the curves move in the vertical direction much more than they move horizontally.
This movement indicates that the module’s voltage isn’t affected very much due to changes in irradiance even though the current is affected dramatically. The MPP also moves a lot due to the changes in irradiance.
PV system designers generally don’t consider the effect of irradiance on volt- age when designing a system. Many consider the module voltage to be at full Voc as soon as the sun comes up and simply adjust this voltage based on temperature (I show you how to perform this calculation in the earlier “Temperature” section).
This is a conservative approach that will serve you well in your own designs. It’s conservative because as the sun comes up, a module’s voltage jumps quickly, as much as 90 percent of Voc with only 200 W/m², but it isn’t at full Voc until the intensity increases. Using this conservative method allows you to build a safety buffer into your system design and installation.
Related Posts
- Solar Energy Systems
- Solar Cell | Photovoltaic Cell
- Solar Concentrator PV Systems
- 3D Solar Cells
- 3D Solar Cell Systems
- Electrical Specifications of PV Modules
- Standard Test Conditions for PV Modules
- PV Arry Charge Controllers
- Sizing a Grid-Direct PV System
- Sizing a Battery-Based PV System
- Site Survey for PV Installation
- Understanding Solar Radiation for PV Installlation
- Concentrating Solar Collectors
- Solar Energy Systems
- Solar Panel Working Principle