A key consideration in the overall performance of any PV system is how the installed system can use the sun’s energy most effectively. For the array to perform at its best, you need to install it so that it has access to as much energy as possible.
Because sunlight is the “fuel” for any PV array, you want to make sure your arrays have full access to as much of the solar resource (the sunlight striking your site) as possible. Having a fundamental understanding of the relationship between the sun and earth allows you to properly site the PV array.
In this article, I introduce you to the different forms of solar radiation and how they affect the production of a PV array. I also present you with the keys to understanding how the sun’s path affects your location. Finally, I give you language to use when describing the exact positioning of PV modules in relation to the solar resource.
Note: I don’t expect you to become an astronomer or dissect solar radiation into its different energy values after reading this chapter. I just want you to focus on the crucial concepts that’ll affect your everyday decisions when it comes to installing any PV array.
High (Or Low) Energy: Solar Radiation
Solar radiation is the term I use to describe the energy that’s sent to the earth from the sun. Having a good understanding of solar radiation is vital because solar radiation is the driving force for all PV systems.
In the following sections, I get you familiar with the various components of the radiation that affects PV modules and help you differentiate between the power and energy values that come from it. I also explain how you can use readily available tools to evaluate the amount of energy received from the sun in the area where you’re working.
Distinguishing between direct radiation and diffuse radiation
The sun, that great nuclear reactor in the sky (and here you thought I wasn’t going to acknowledge nuclear energy’s role in the need to address the world’s power sources), is constantly hurling radiation toward earth.
Approximately eight minutes after that radiation leaves the sun, the surface of the earth is assaulted by it. The exact amount of radiation and how you describe it depends on the planet’s atmospheric conditions. On a clear day, there’s little to interfere with the radiation; on a rainy day, the cloud cover greatly reduces the radiation that can reach you.
When you work with PV systems, two main components of the sun’s radiation dominate your attention: direct and diffuse radiation. Both contribute to the overall radiation levels on earth, but it’s important to remember that they’re two separate pieces (see Figure 1 for a representation of these radiation components).
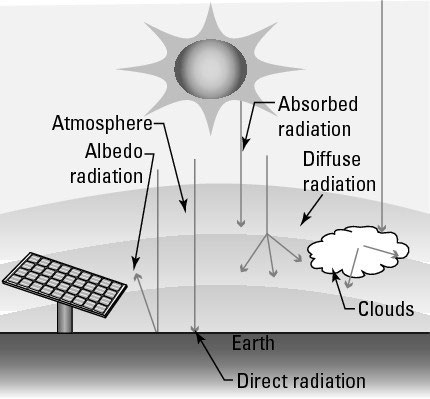
Direct radiation: The direct radiation from the sun isn’t intercepted as it travels from the sun to the earth’s surface. It therefore makes the greatest contribution to a PV array and has the biggest effect on the array’s ability to convert sunlight into electrical energy. On clear, sunny days, the vast majority of the solar radiation experienced is in the form of direct radiation.
Diffuse radiation: The sun’s diffuse radiation takes a more roundabout path to the earth. Typically clouds, water vapor, dust, and other small air-borne particles block and scatter the diffuse radiation’s path to the planet’s surface.
The diffuse component of solar radiation therefore plays a minor role in the power output of a PV module. However, on days when clouds cover the sky, all the radiation is in the form of diffuse light without any direct radiation component.
Another form of diffuse radiation, albedo radiation (or reflectance), is part of the solar radiation at a site. It’s light that’s reflected from physical surroundings, such as a roof or the ground, and put back into the atmosphere as diffuse radiation. The total global radiation received at a given site is the sum of the direct, diffuse, and albedo components.
To help you better understand solar radiation, think of it as money coming into your possession: Direct radiation is like the money you get from your paycheck, and diffuse radiation is like the money you get from an interest-bearing savings account. On days when you get a lot of work (the sunny days), your paycheck (direct radiation) is the major contributor to your bankroll; the savings account interest (diffuse radiation) contributes only a small amount.
On the days when work is lean (those dark, gray days), your paycheck may contribute very little, if at all, to your wallet, whereas the savings account interest still contributes a small amount to your net worth.
One measurement that affects the solar radiation striking the earth is air mass, or the amount of atmosphere the radiation must pass through to reach the earth’s surface. You don’t need to spend too much time on the subject, but keep in mind that PV module manufacturers use a standard air mass value when rating their modules.
Determining the Intensity of Solar Radiation: Irradiance
After you know a little bit about the components of the radiation coming from the sun (which I share in the preceding section), you can throw some numbers into the mix. The term for the intensity of the solar radiation striking the earth is irradiance, and it’s a measurement of power over an area.
The standard units associated with irradiance are watts per square meter (W/m²), but you can also easily refer to them as kilowatts per square meter (kW/m²).
The amount of irradiance striking a PV module at any given moment is affected by a number of factors, including the location of the module, its position relative to the sun, the time of year, and the weather conditions.
I cover most of these factors later in this article; in the next sections, I explain the irradiance-related basics that you need to know.
Recognizing special conditions that can affect irradiance
Some common occurrences increase the irradiance levels striking PV modules:
Albedo radiation: Also known as reflectance, albedo radiation comes from light-colored materials, such as snow or a white roof, in the array’s vicinity. Increases due to albedo radiation generally aren’t extreme, but they can have a measurable impact, with increases as much as 5 to 10 percent (see the earlier “Distinguishing between direct radiation and diffuse radiation” section for an introduction to albedo radiation).
The edge-of-cloud effect: This is where a cloud passes over the PV array and prevents the sun from striking the array. As the cloud moves past the sun, the edges of the cloud actually concentrate the solar radiation and increase the irradiance values on the array. These occurrences are generally short-lived (the longest one I’ve ever seen recorded was 15 minutes), but they can increase the irradiance by more than 25 percent.
So should you try to increase irradiance through the use of mirrors or other reflective surfaces? The short answer is no. PV modules have been manufactured to operate without these enhancements. Adding them actually causes modules to deteriorate faster than normal, so the net effects are a shorter life span and a smaller energy output.
Checking out charts to see irradiance differences
One way to really tell the difference between irradiance on sunny versus cloudy days is to examine charts that measure all the irradiance values, like the ones in Figures 2 and 3 (the values shown are in W/m²).
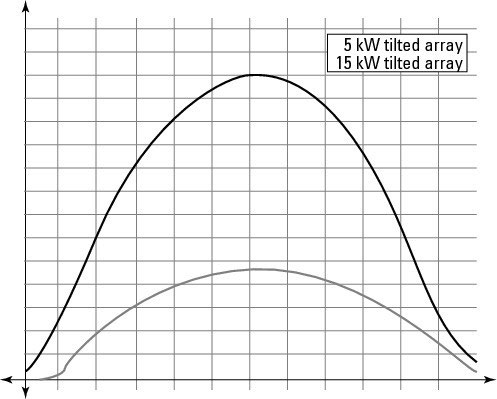
As you can see in Figure 2, the irradiance levels for a location on a perfectly cloudless day look a lot like a haystack curve. The irradiance values are at 0 W/m² at night and begin to climb as the sun rises in the sky. The irradiance values peak at solar noon and then decrease as the sun starts its descent to sunset.
(Notice how the y-axis of the graph, which represents the irradiance values, doesn’t have any numbers associated with it? That’s because this graph is just meant to show you the typical look of the irradiance values over the course of one day.)
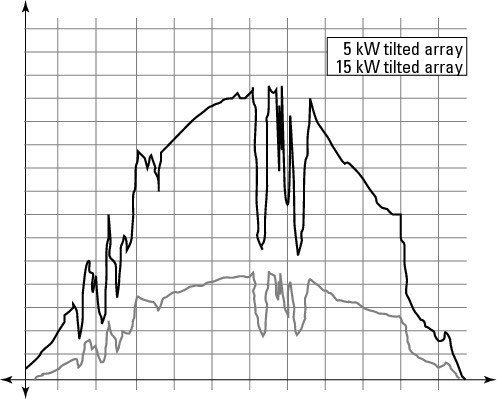
In contrast, Figure 3 shows that the irradiance levels on a partially cloudy day are much more erratic. The amount of irradiance measured moves up and down, indicating the movement of clouds between the sun and the array.
PV modules produce current (the flow of electrons) and voltage (the pressure that makes electrons move) when exposed to sunlight and the electrons are given a path to flow in. Although voltage isn’t greatly affected by irradiance, current is directly dependent on irradiance.
As soon as ambient light is present (at sunrise or even during a cloudy day), the PV module will have nearly full voltage present. Current, on the other hand, will vary throughout the day as the irradiance values increase and decrease.
The exact amount of current produced by a module is directly proportional to the irradiance level. The brighter the sun is (high irradiance), the more current will flow.
So when you’re inevitably asked whether PV works under cloudy conditions, know that the answer is (a qualified) yes. Because the irradiance levels are so low on cloudy days, very little current is produced, which means the PV module can provide only a little power on cloudy days (this is true whether the PV system uses batteries or is connected directly to the utility). All PV modules report their voltage and current levels at standard test conditions (STC). For irradiance, this value is 1,000 W/m², and it’s often given the name peak sun. You can think of peak sun as the intensity of the sun at sea level on a nice, sunny day. It isn’t the maximum irradiance you’ll ever see, but it is a point on the chart.
(Actually, you have no control over the amount of irradiance striking the modules, which is why you must add some safety factors when sizing conductors and safety components.)
Measuring irradiance with a pyronometer
You can measure irradiance on the job site to estimate the current value from the module or array and compare that to the actual current measurement you make with a digital multimeter.
Irradiance measurements are used most often for data collection and in troubleshooting applications. Because the amount of current flowing from the array is directly related to the irradiance, by measuring and comparing both, you can quickly determine whether the PV array is performing to expectations.
Never try to measure irradiance without a pyronometer. You’ll do a horrible job if you try and “eyeball” it. Pyronometers allow you to point the meter in any direction and obtain a numerical value of the irradiance. You can buy a small hand-held unit for about $150, or you can invest in a high-accuracy meter (like the kind used in laboratory environments) for thousands of dollars.
Personally, I recommend the less expensive kind, especially if the pyronometer is going to live in your toolbox. To use a pyronometer, simply turn the device on, place the sensor in the same plane as the array, and read the meter. Keep in mind that the sensor consists of a small PV cell that has been calibrated at the factory. It may not be the most accurate tool, but it’s a handy device for what you need.
Calculating Solar Radiation Energy: Irradiation
A successful PV system designer and installer not only knows how to track irradiance levels over the course of the day but also how to calculate the energy values from the solar radiation at the site. These energy values are referred to as irradiation and are based directly on the irradiance levels received. You use irradiation values to help figure out how much energy a PV array will produce at a particular site.
Energy is determined by multiplying power (measured in either watts or kilowatts) by a duration of time, typically an hour. Consequently, energy is typically measured in kilowatt-hours (kWh). The power received from the sun is measured in W/m², but with a quick conversion (1,000 W = 1 kW) you can transform that into kW/m². If you take that power value and multiply it by the number of hours that receive that much irradiance, the result is kWh/m².
However, as you can see if you refer to Figures 2 and 3, irradiance values aren’t constant for hours at a time. In fact, they can change with the blink of an eye, which leads to the following question: If the irradiance values are only constant for seconds, or minutes at best, how am I supposed to take that information and turn it into kWh/m², which is the energy value I really need?
Love it or hate it, the answer lies in calculus. What you’re really after is the area beneath the curve, and you can find it with a few quick calculations. If you’re a calculus-hater, you’re in luck — I don’t mess with any advanced math here.
That’s because the good folks at the National Renewable Energy Laboratory (NREL) have done the hard work of calculating areas beneath curves and have broken down the results into a single number for easy use.
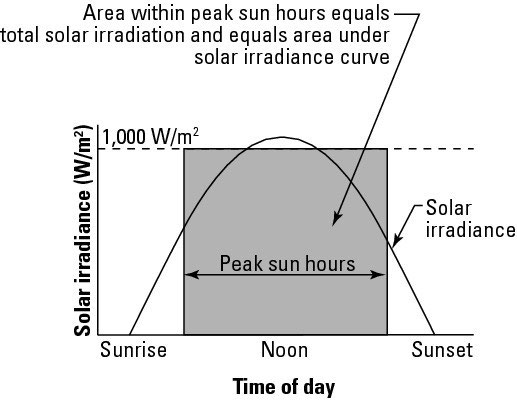
Take a look at Figure 4. It’s actually the same irradiance curve as the one I present in Figure 2 for a perfectly cloudless day, with the exception of a square box drawn over the curve. This box represents the equivalent area covered by the curve.
In other words, the NREL has turned a curve into a box. As I show you later in this article, the NREL publishes this information for a number of locations for your reference. With the area beneath the curve represented as a box, you have one irradiance value to use and an easily defined number of hours. Now you can simply take the irradiance value, multiply it by the number of hours, and find the energy value (yes, that’s right — irradiation).
For example, if the top of the box intersects the irradiance line at 850 W/m² and the number of hours is equal to 4, then you can calculate the energy received at this location as follows: 850 W/m² x 4 hours = 3,400 Wh/m² = 3.4 kWh/m²
Just for a day: Peak Sun Hours
Typically, irradiation values have an associated time period, such as the num- ber of kWh/m² over the course of a day, month, or year. As a PV designer, plan to look at all of these periods, but focus on the daily values.
The amount of solar energy received at a particular location each day is measured in terms of the energy per unit area per day (kWh/m²/day). The PV design lingo for this numerical value is the number of peak sun hours or insolation.
In the sections that follow, I explain how to use peak sun hours to determine a PV array’s energy output and point you toward some handy charts and maps that list peak sun hours.
The terms peak sun hours and insolation are used interchangeably because both refer to the solar energy received at a site over the course of one day. They’re also both measures of irradiation (solar energy), but they have a specific time value (one day) associated with them.
Using peak sun hours to calculate energy output
In the earlier “Relating current and voltage to irradiance” section, I tell you that the term peak sun refers to an irradiance value of 1,000 W/m². Well, the number of peak sun hours describes the number of hours each day that the irradiance value equals 1,000 W/m².
You probably don’t even have to refer to Figure 4 to remember that the sun doesn’t just pop up over the horizon, go to 1,000 W/m², and sit there all day. At times, the irradiance values will be very low; other times, they’ll be very high.
The number of peak sun hours is merely an estimation of the amount of time each day that the irradiance is equal to a peak sun. And because PV models are rated for their output under peak sun conditions, the number of peak sun hours each day indicates how many hours each day the PV array will operate at its full power output. I think an example, complete with numbers, would be a good idea here.
To start, divide your insolation value by peak sun to get a number of hours per day. Check out the example in the earlier “Calculating solar radiation energy: Irradiation” section, where the box in Figure 4 intersects the irradiance line at 850 W/m² and the amount of time is 4 hours. The result of the equation is 3,400 Wh/m² of energy (or 3.4 kWh/m²).
Because this measurement was taken during a single day, it’s actually an insolation value (3.4 kWh/m²/day). By dividing that value by one peak sun (1,000 W/m², which is equal to 1 kW/m²), you get the number of hours each day that the PV array will operate at its rated output. 3.4 kWh/m²/day ÷ 1 kW/m² = 3.4 hours/day You then multiply this number of hours by the power value of a given array to figure out the expected maximum energy output.
So if I have a 3 kW array on my house and the number of peak sun hours today is 3.4, I can calculate the expected energy output by multiplying the two together. 3 kW array x 3.4 peak sun hours = 10.2 kWh of energy
Note: The number of peak sun hours varies with a number of factors, most notably the time of year and your position on the globe. I show you more details on these effects later in this article.
Referring to handy charts and maps
After you know how to make calculations using peak sun hours, how do you know precisely what peak sun hour numbers to use for your client’s area? NREL to the rescue! You can find peak sun hours data for more than 200 U.S. locations on the NREL Web site.
Granted, other sources of peak sun hours data are out there and you can spend a lot of time dissecting all of them, but I show you the NREL data so you can acquire a fundamental understanding.
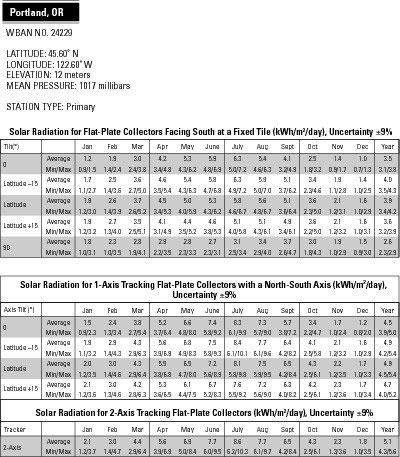
In Figure 5, you see an example of the data set NREL publishes in its Solar Radiation Data Manual for Flat-Plate and Concentrating Collectors. (Nicknamed “the NREL Redbook,” this resource also has a good introduction to help you better understand all the terms the Redbook uses in its charts.)
Although all the values shown are based off of arrays that point true south, these tables also list multiple solar resource values based on the tilt of a PV array that’s positioned on a horizontal surface rather than a vertical one.
On the left-hand side of Figure 5, you see 0°, Latitude –15°, Latitude, Latitude +15°, and 90°. Latitude –15° means the tilt angle of the PV array off of the horizontal is equal to the local latitude minus 15°. (I get into the details of these values later in this article. For now, just focus on the fact that the PV array is moving from flat to vertical as you look down the far-left column.)
As you move horizontally across any of these different tilt-angle designations, you see numerical values for the number of peak sun hours for each month. The unit for these values is kWh/m²/day, or peak sun hours.
Think of it as the average number of hours each day of that month when your PV array will operate at its rated output. If you keep moving to the right along any row, you see that the last value is the average peak sun hours for the year for an array at that particular location.
You can quickly compare this value among all the tilt angles listed to get an idea of the best tilt angle for an array at the client’s specific location. (I tell you all about tilt angles later in this article).
As a general rule, the number of peak sun hours increases as you move from winter to summer and then begins to decrease again as you move back toward winter. The exact amount of change is dependent on the tilt angle of the array and the latitude.
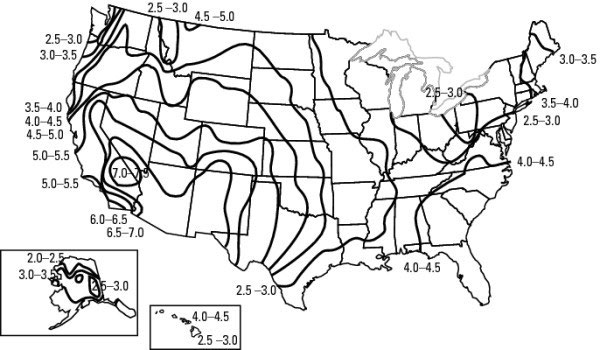
You can get an idea of the peak sun hours available across the United States in Figure 6. As you can see, the greatest amount of peak sun hours occurs in the southwest, and the numbers decrease as you move north.
This chart can help you generalize and compare your location to others, but you should only use it to create a rough estimate of your location. You always need to look up the specific site you’re working in to make an accurate energy-production estimate.