Measuring Information in Degrees
Some factors that are relatively constant on sites within a geographic region are the magnetic declination (the direction a compass points toward north versus true north), insolation data (the number of peak sun hours), and local climate conditions.
Factors that differ on nearly every installation, no matter the location of the site, include the tilt angle of the array (the number of degrees it is off of the horizon), the azimuth the array faces (the number of degrees from true north), and the shading considerations.
In the following sections, I explain how to measure the three pieces of vital information that are measured in degrees: magnetic declination, the array’s tilt angle, and the array’s azimuth.
Understanding magnetic declination
The term magnetic declination refers to the number of degrees that a compass needle differs from true north. (If you do a fair amount of navigation — flying, boating, mountaineering, and the like — you may refer to this as magnetic variation; that’s just another term for essentially the same thing.)
For locations in the Northern Hemisphere, you want a PV array to be facing true south as much as possible — something you can’t make happen if you follow exactly what a compass tells you. If you were to use your compass and point the array the same direction as the “south” needle on the compass, you’d be as much as 20 degrees off from true south, depending on your location.
To make sure an array points toward true south, you need to know what your magnetic declination is. Depending on where you are in the United States, a compass’s north needle points either to the east of north (the western half of the country) or to the west of north (the eastern half of the country); the Mississippi River is roughly the dividing point.
The designations are referred to as eastern (positive) declination for locations in the western part of the country and western (negative) declination for locations in the eastern region of the country.
These designations refer to the direction that the north needle is pointing in reference to true north. Ultimately, you need to concern yourself with true south more than true north (which is contrary to what most people are taught). Why, you ask? Well, for the Northern Hemisphere, the sun is located in the southern half of the sky, which is where you want to point your PV modules.
You need to turn yourself 180 degrees and think about how the declination value affects the mag- netic south and true south locations. For example: When you’re on the west coast and using a compass to find south, the south needle is actually pointing southwest of true south (because the north needle is pointing northeast of true north).
To account for this, you need to turn yourself to the east to find where true south is. When you’re on the east coast, the opposite occurs. The south needle points southeast of true south (because the north needle points northwest of north). Turn to the west to find true south.
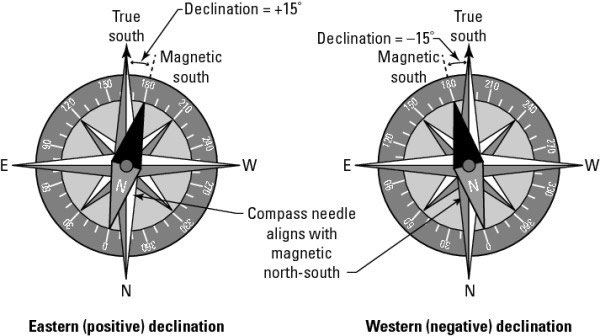
Figure 1 gives you the visual of these two examples. (Don’t worry if the concepts still don’t make sense; they can be difficult to grasp. I still have to stop and think the process through to make sure I get it right on a roof.) To add to it all, magnetic declination is a dynamic value, meaning the number of degrees your compass lies to you is constantly changing. It doesn’t change rapidly, but it does change. True south, however, never changes, so after you find it, you don’t have to worry about going out to the client’s PV array every five years and adjusting it a few degrees.
The National Oceanic and Atmospheric Administration (NOAA) has a great declination calculator on its Web site that can help you find the exact value for your client’s location; you can find it at www.ngdc.noaa.gov/
To find the point on your compass that relates to true south, you need to know the magnetic declination for your client’s area and subtract that from 180 degrees (north is 0 degrees, so south is 180 degrees on the compass): For locations in the western part of the United States, true south is desig- nated on the compass as 180 degrees – declination.
For locations in the eastern part of the United States, you still subtract the declination value, but because the declination is a negative number to begin with, the equation becomes 180 degrees + declination.
Technology can help you evaluate the declination at a site during a site survey, but even the greatest technology requires you to input the starting information correctly.
If you can at least keep the general rules about magnetic declination in mind, you should see consistently accurate data — provided, of course, that you’re not trying to use your compass in a location that’s close to steel objects, which cause a compass needle to point in any number of directions and prevent it from finding magnetic south.
If you can’t find magnetic south, you’ll have a tough time finding true south by subtracting the magnetic declination value.
Calculating the array’s tilt angle and azimuth
In a typical PV installation, the array is located on top of a building. In this scenario, the most cost-effective installation method places the array parallel to the roof and pointing in the same direction as the roof because the additional requirements for securing an array that isn’t parallel to the roof surface can become over-whelming.
Aesthetics are another consideration. I know, I know. Beauty is in the eye of the beholder, but an array that looks awkward on a roof doesn’t make passersby say, “Gosh, I sure would like that on my roof!”
Knowing an array’s tilt angle and azimuth can help you properly place one on a roof. I explain what you need to know to calculate these values during a site survey in the following sections. (If these concepts don’t sound familiar to you, check out Chapter 4 for a quick introduction.)
Note: The approaches in the following sections refer to roofs and the methods used to calculate an array’s tilt angle and azimuth in relation to a roof. If you’re installing an array on the ground, the same approaches apply; you just don’t have a roof to reference and need to use landmarks instead.
The tilt angle
You have a couple options for figuring out the tilt angle of an array that will be both functional and eye pleasing:
Use an angle finder: To use this tool, which is also called an inclinometer, simply place it on the face of the surface to be measured and wait until the rotating dial comes to a stop. The face of the tool has degree measurements on it in relation to a flat surface so you can record the angle off of the horizon by noting the degree location where the dial stops spinning. Because most PV arrays are mounted parallel to a roof, this angle is the same for both the roof and the array.
Use a little math: If you can measure the amount of height the array changes (rise) over a certain horizontal distance (run), you can calculate the corresponding angle. After all, who doesn’t love some good old-fashioned trigonometry? A common approach is to give the rise of a roof over a distance of 12 inches. You may hear a roof slope (angle) referred to as X:12. What this is saying is that the roof rises X inches for a run of 12 inches. The smaller the X number is, the lower the slope is for that roof.
If you’re given the roof slope this way, you can quickly convert the variable to a number of degrees by using a calculator with basic trigonometry functions. The calculation is: arctan (rise ÷ run). The arctan function is represented as tan-1 on many calculators.
Therefore, if I tell you that a roof has a slope of 6:12, you can calculate the number of degrees with this operation: arctan (rise ÷ run) = arctan (6 ÷ 12) = arctan 0.5 = 26.6 degrees.
If you aren’t given the roof slope, the easiest way to figure it out is by using an angle finder. However, you can also use a bubble level and a tape measure. If you choose to go this route, hold the level with one end touching the roof and the bubble centered in the viewing glass (in other words, hold it so that the level is level).
Use the tape measure to see how many inches the roof surface is from the end of the level that’s above the roof. You now know that the roof rises that many inches (from the tape mea- sure) over a run that’s equal to the length of the level.
The azimuth
Satellite images are an immense help when conducting a site survey, especially when you need to calculate the azimuth. With the help of satellite images, you can know the azimuth of the roof with magnetic declination accounted for before you even set foot on it. These images show the site in relation to true north and true south. So if you find your array location (typically a building) on the satellite image, you can determine the roof’s azimuth without having to use your compass.
Why? Because the satellite images have a built-in compass that’s pointing true north. If you can find your client’s building on the satellite image, you can use this built-in compass to estimate the true azimuth of the building (with magnetic declination accounted for).
Another handy online tool is available at https://www.solmetric.com It lets you find a satellite image of a building and use your mouse to determine the building’s azimuth.
The downsides to satellite images are their resolution and the time when they were taken. A remote location may have poor image resolution. Other times, the image is a few years old, and the building you’re looking for isn’t in the image yet. In these situations, you have to obtain the information you need on-site. The address look-up tools on these products aren’t perfect either, so you may need to confirm with your client which building is the right one before you head to the site.
Depending on the services you need, one of these options may work for you: Google Earth (earth.google.com) and Bing Maps (www.bing.com/maps) let you see the building you’re looking for with a decent amount of detail after you type in the address.
Some of these images can also be used in conjunction with free three-dimensional drawing programs (such as Google SketchUp, found at sketchup.google.com) to really help you evaluate and analyze your site. Subscription-based programs such as Pictometry (www.pictometry.com) can give you even more detail. Smartphones offer applications that can come in handy during a site survey.
You can download apps to your phone that perform shading analysis, calculate tilt angles, and even help with some of the NEC® calculations. These phone apps are currently available solely for the iPhone, but with the speed at which the wireless world moves, I’m sure that will all change very quickly.
If you print a couple copies of the satellite images for your client’s site before- hand, you can take notes and record measurements directly on the printouts without having to re-create the building or array location with hand drawings. I recommend printing at least two or three clean copies so you have plenty of space to make notes for yourself.
Exploring Shading-Analysis Tools
When you perform a shading analysis during your site survey, you look at the area surrounding the proposed PV array location and estimate the amount of sunlight that’s blocked from obstacles like trees and buildings. This analysis is what allows you to give your client a realistic expectation of the energy that can be delivered by the PV system over the course of a year.
Shade on a PV array can drastically reduce the array’s power output, which in turn reduces its energy production. Although a perfectly sunny spot is preferable, the reality is that shading is a simple fact of life in many locations. Some situations can be altered (a tree can be trimmed or removed), but others can’t (the neighbor’s house isn’t going anywhere). The goal for any PV site is a location that’s shade free three hours before and three hours after solar noon.
This time frame allows the PV array access to full sun during the portion of the day when the irradiance values are at their highest. (If this time window isn’t an option, like in the winter, look for a window of two hours before and two hours after solar noon as a minimum.)
By using a shading-analysis tool, which recognizes the shading objects in the PV array’s solar window (all the points between the sun’s lowest and highest points in the sky) and calculates the effect that shading has on the array, you can effectively determine the shading effects from objects located in the array’s vicinity.
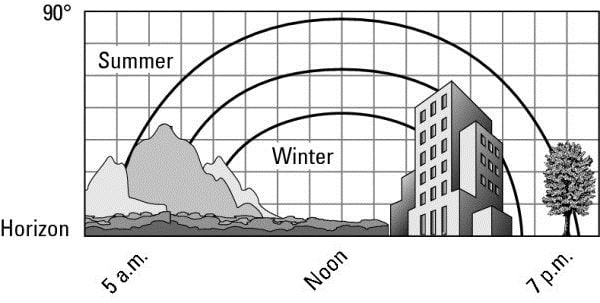
Figure 2 illustrates how a shading-analysis tool transfers the obstructions in the site’s solar window to a sun chart that you can analyze (I explain how to perform this analysis later in this article). You can also use shading-analysis tools to propose “what-if” scenarios, like what’s the overall impact if we remove that tree in the distance?
The shading-analysis tools
I outline in this section work the same way. I’ve used all three tools and feel that they’re quality products that deliver good information when used correctly. (Because they all work off of the same principle, you may want to check out the sun-path information)
Of all the tools I suggest you keep in your site-survey bag, a good shading-analysis tool will be your single biggest expense (unless of course you buy the best-of-the-best digital camera). It’s a tool you can’t do without though, so research your options and think about how (and how often) you plan to use it before buying one.
Always use a shading-analysis tool at the proposed array location. If you can’t get to that, use the manufacturer’s instructions to adjust the information you collect so that it describes shading at the actual array location.
One of the greatest features of the following three shading-analysis tools is their ability to evaluate a site for an entire year at once. They all use site-specific solar charts and local weather data for the site analysis, which means you can go out to the site at any time (as long as enough light is available so you can see the area surrounding you) and collect all the information you need.
ASSET: The Acme Solar Site Evaluation Tool (abbreviated as ASSET and found at www.we-llc.com/ASSET.html) is a shading-analysis tool that uses a digital camera and software to evaluate a site. All you have to do is set the camera up in a special base that incorporates a level and compass. ASSET then takes seven pictures, starting with the camera pointing due east and rotating the camera to the west. The result is a panoramic picture of the site.
After you have your panoramic view, you download the pictures into the ASSET software so the program can return a single picture (made of the seven individual ones) with the solar path on top of the site. ASSET also recognizes shading objects and reports the overall loss of the solar resource due to shading.
Solar Pathfinder: The Solar Pathfinder (found at www.solarpathfinder.com ) has a long history within the solar industry. It consists of a plastic base that integrates a level and compass and holds a paper sun chart. (The company makes sun charts for various latitudes, so the Solar Pathfinder can be used virtually anywhere.)
The final piece is a transparent dome that sits directly over the sun chart in the base. This dome reflects the surroundings and allows you to project those objects down to the sun chart below. You can then either trace those objects directly onto the sun chart or take a digital picture of the tool and download that picture into Solar Pathfinder’s optional software for further analysis.
The software option is a powerful tool that can help you better estimate the shading effects on that site. In fact, if you’re purchasing a Solar Pathfinder for the first time, don’t even consider the software optional; just buy it. The additional information you get from the software is worth the investment.
Solmetric SunEye: One of the newest entrants in the shading-analysis-tool market is the Solmetric SunEye (found at www.solmetric.com ). It’s a fully digital tool that incorporates a fish-eye camera, compass, and level into a base with a screen showing the site complete with sun chart and obstructions.
The machine evaluates the site by taking a photo at the array location and using some site-specific data, such as magnetic declination and local climate readings (note that you have to input some basic site parameters in order for the SunEye to be able to retrieve the proper information). It then returns detailed information about the shading effects.
Interpreting the Data and Bringing It All Together
During your site survey, you go to the site and gather all the data you need (de- scribed earlier in this article). That’s great, but what do you do with all that data afterward? As you find out in the following sections, you compile it and analyze it to determine the best PV system solution for your client. Specifically, you must evaluate the following:
- The area available for the array
- The options for mounting the array
- The electrical considerations
- The array orientation
- The shading effects
Analyzing reports from your shading-analysis tool
Shading-analysis tools generate a report that’s associated with the site. This report helps you during the design and installation portions of a job because having this information allows you to avoid shading issues that may reduce the overall energy output. Here are some important pieces of information revealed in a typical report from a shading-analysis tool (this is the information your client is most likely to care about):
The effect of shading on an annual basis: This is the most basic level of information you absolutely have to walk away with. It may be reported as a percentage of the ideal insolation or as a new amount of insolation. Either way, you can have your shading-analysis tool break down this information month by month so you can see where the big hits are. Ideally, you’ll have very few losses due to shading.
In the next section, I show you how to incorporate the shading losses and the array’s orientation losses to account for all the site-specific losses (note that the combination of shade and orientation losses shouldn’t reduce the site’s potential by more than 25 percent).
Estimations of the energy production based on different scenarios: These estimates allow you to vary the tilt and azimuth to see how such adjustments may benefit the installation.
Predictions of how the PV array would perform if the obstructions were removed: You can estimate the array’s production if, say, a tree weren’t in the way and allow the client to choose between keeping the tree or obtaining additional energy from the array by removing the tree.
Considering the total solar resource factor
When shading-analysis tools evaluate a site, they typically look at the shading effects as well as the effects of the tilt and azimuth. The combination of these factors is defined as the total solar resource factor (TSRF). The individual components of the TSRF are often referred to as the shading factor (SF) and the tilt and orientation factor (TOF). (Orientation is another word for azimuth.) Both are reported as a percentage of the ideal situation.
For shading, the ideal situation is an absence of shading; for tilt and orientation, the ideal situation is pointing a stationary array at a specific tilt and azimuth to have the array produce the maximum amount of energy annually. You need to figure out what the TSRF is so you can accurately predict the amount of energy that the PV array will produce annually.
The SF value is, obviously, totally dependent on shading. If a site were to have no shading, the SF would equal 100 percent. That’s pretty difficult to achieve, but an excellent site has shading factors greater than 95 percent (meaning less than 5 percent of the solar resource over an entire year is lost due to shading).
The TOF value, given in terms of a percentage, is estimated by evaluating the PV array’s tilt and azimuth compared to what the absolute ideal tilt and azimuth for a PV array in that same location would be. These values are typically represented as a graph with concentric circles (or ellipses) that represent different levels of the resource.
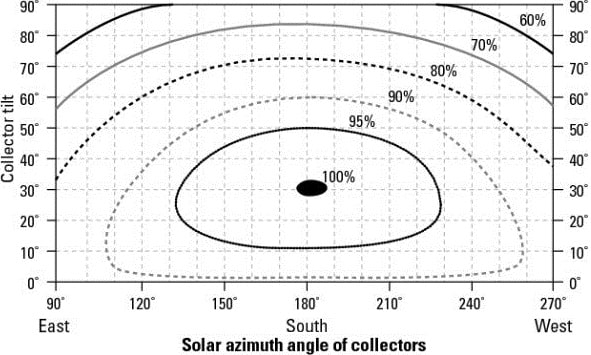
Figure 3 shows one such graph. The vertical axis represents the tilt angle of the PV array, and the horizontal axis represents the array’s azimuth. The innermost circle represents the ideal tilt and orientation for this location. As the array moves away from that circle, the amount of solar resource is reduced.
To estimate the TOF with such a graph, simply find the point on the graph where the proposed array lands and apply that percentage for the TOF. To calculate the TSRF, you multiply the SF by the TOF. The result is the total resource available after these inefficiencies are considered.
For example, if you perform a shading analysis and find the annual reduction of the resource due to shading is 9 percent, that would equate to an SF of 91 percent. If you located the array in a location where Figure 3 applied and the array was tilted at a 20 degree angle and a 165 degree azimuth, the TOF value would be 97 percent. You can determine this percentage by placing an X at the intersection of the 20-degree tilt and the 165-degree azimuth on the tilt and orientation graph.
The X falls between the 95 percent ring and the 100 percent ring, so you can estimate the value to be 97 percent. The resulting TSRF value would be 91 percent x 97 percent, or 88.3 percent. This TSRF value tells you that the site’s output will be reduced by nearly 12 percent when compared to a PV array oriented toward the ideal location with absolutely no shading.
The TSRF should be greater than 75 percent for your PV arrays. Anything less than that is marginal at best. Many rebate programs require that the TSRF exceed a minimum value (typically 75 to 80 percent), so be sure to find out the restrictions tied to any rebate money your client may be expecting.
You can then use the TSRF to estimate the amount of energy the array will produce by multiplying it by the peak sun hours data available from sources such as the NREL Redbook . Another source for this information (as well as handy tools to estimate the TOF values) is Solmetric, the manufacturer of one of the shading-analysis tools I recommend earlier in this chapter; you don’t have to use Solmetric’s tool in order to use some of the features of its Web site (www.solmetric.com).
Using other collected information to plan out the design and installation
The other information you collect during your site survey (such as general site information, structural and mechanical information, and electrical information) comes in handy during the design and installation process. Many municipalities and rebate programs want to see some basic drawings of the site and associated hardware used. You’ll need to reference the information you collected to establish a bill of materials and the estimated cost of installing the system. Using the information gathered during your site survey, you should be able to determine the size of the PV array that can go in the proposed area.
The square footage of the area available and the module of choice for the array dictate the size of the array. You may also need to account for walking paths around and between rows of modules, so the total available area may actually be less than what it appears at first glance.
A good plan for a roof-mounted array is to allow for access around the array. If you pack a roof with modules, not only will the installation process be difficult and more dangerous, but you’ll also make it nearly impossible for anyone to get on that roof in the future.
A good number to keep in your head is 10 W per square foot of open roof area. So if you have 200 square feet of open roof area, an off-the-cuff estimation for the PV array is 2,000 W, or 2 kW. This value accounts for space that can’t be fully utilized by the array. It’s slightly on the conservative side, meaning you can probably fit more wattage in that area, but it’s a great starting point and generally within reason.
Establish any potential upgrades to the structure for either the array or the other components.
If you spot a potential problem area in the roof framing information that you collected during the site survey (see the earlier “Structural and mechanical information” section), you can use this information, along with an engineer’s report, to justify the addition of more bracing or supports to the existing roof.
Identify the racking structure used.
You can narrow down your options based on the defined array location and the array’s potential size.
Decide on the best method to run all the conductors to and from the inverter and tie into the electrical system.
As part of the site survey, you examine the potential wire runs and the best methods for getting from the array to the inverter and then to the MDP (or subpanel).
Identify all the major components for installation per local requirements.
By becoming familiar with the local jurisdiction’s requirements as well as the local utility’s requirements, you can establish all the major components needed and their approximate locations to save yourself some time and hassle during the installation process.
Related Posts
- Solar Energy Systems
- Solar Cell | Photovoltaic Cell
- Solar Concentrator PV Systems
- 3D Solar Cells
- 3D Solar Cell Systems
- Electrical Specifications of PV Modules
- Standard Test Conditions for PV Modules
- PV Arry Charge Controllers
- Sizing a Grid-Direct PV System
- Sizing a Battery-Based PV System
- Site Survey for PV Installation
- Understanding Solar Radiation for PV Installlation
- Concentrating Solar Collectors
- Solar Energy Systems
- Solar Panel Working Principle